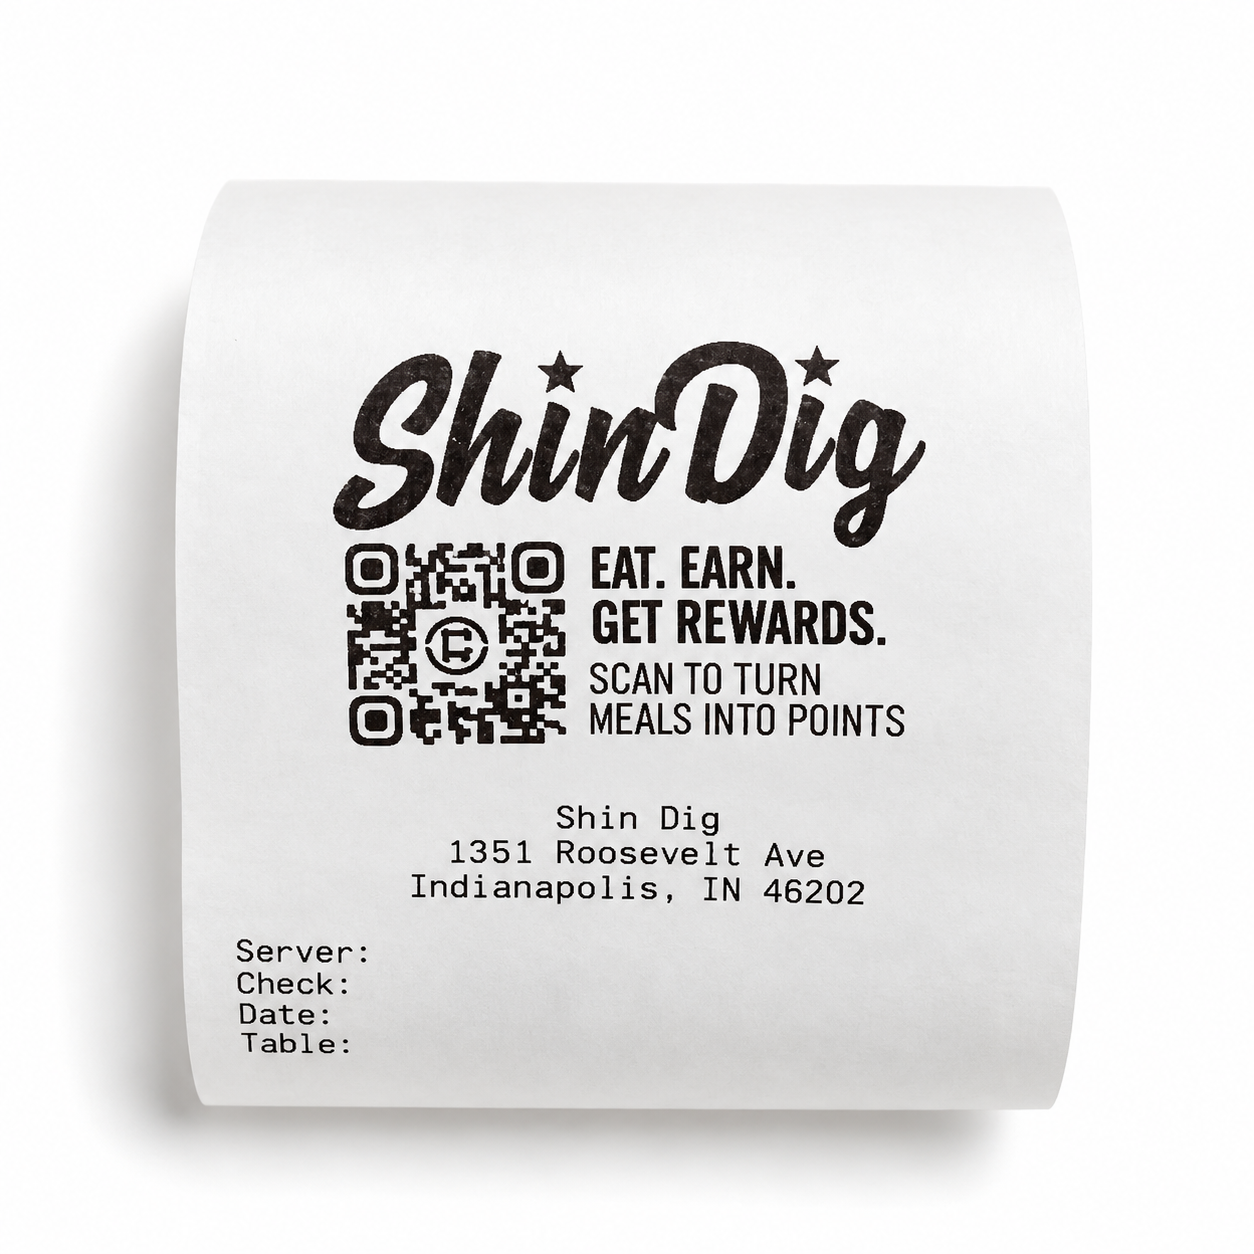
Build a physical-to-digital touchpoint that keeps working.
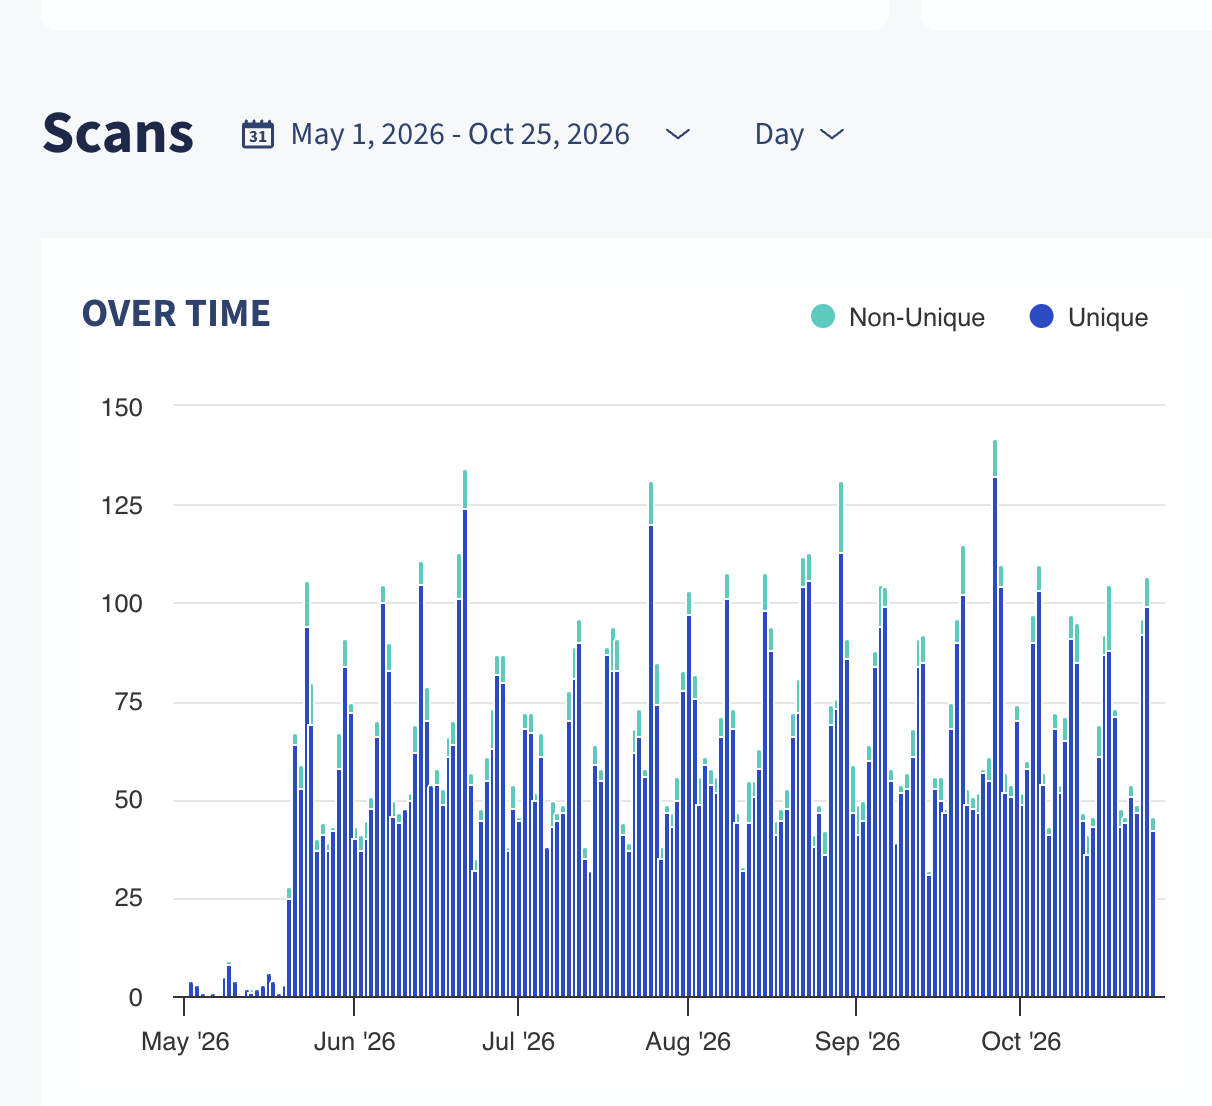
The dashboard shows a low-volume launch period in May followed by substantially higher activity from June through October, with recurring daily peaks above 100 scans. Across the full period, the initiative averaged roughly 61 scans per day.
MayOct
Portfolio interpretation is based on the supplied dashboard totals and trend view. Scan traffic should not be described as completed VIP sign-ups.